Architecture Overview
Work in progress
This page is a work in progress and requires review. Please file an issue if information or coding is missing, incorrect or out of sync with the main repository (ramp-pcar/ramp-pcar).
Scope and Exclusions
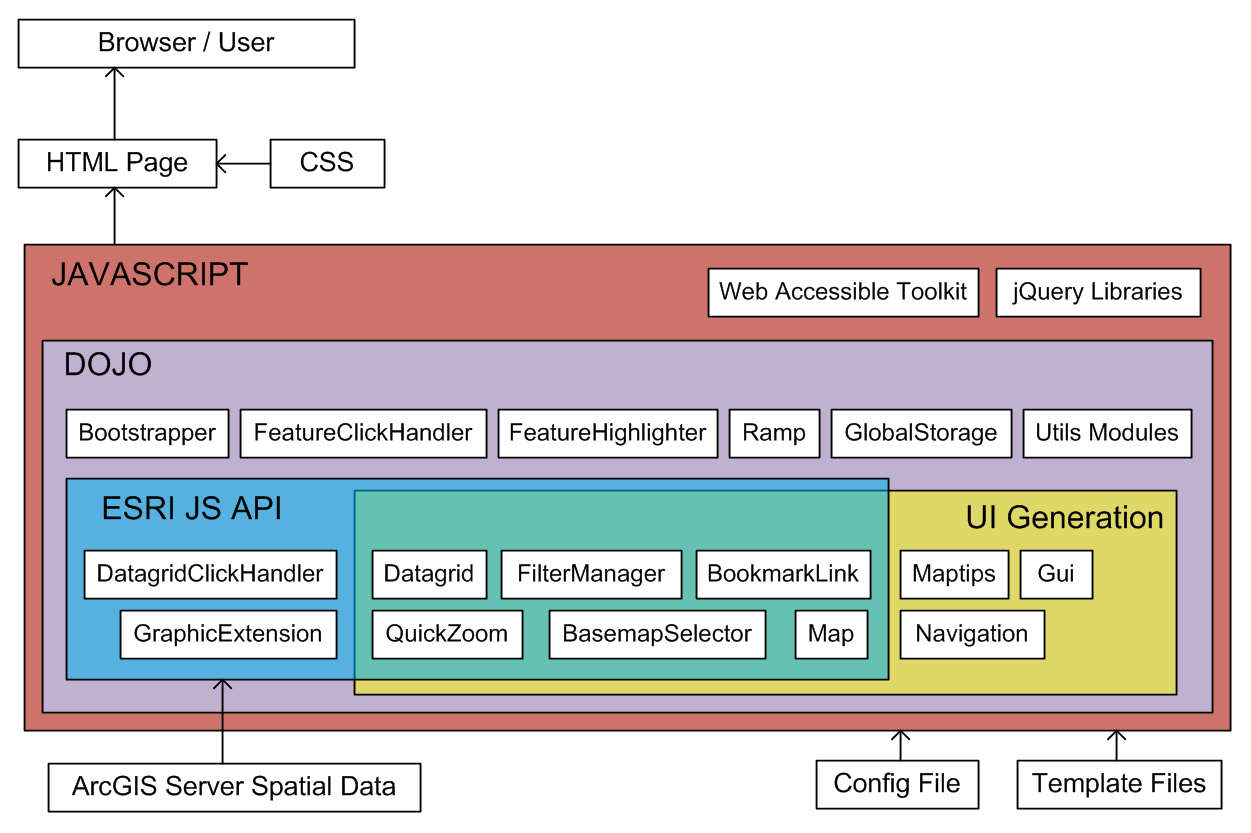
The architecture overview covers how various components of RAMP work together and accomplish the functions that are provided out-of-the-box. In particular, it covers the functions that reside in the RAMP codebase, but not functions that are provided from 3rd party libraries.
For information on how to use and configure RAMP, please see the Getting Started and User Guide pages.
We do not delve into the inner workings of the DOJO API. A wealth of information can be found on the DOJO site.
The inner workings and usage of the ESRI Javascript API are not covered. The official site offers articles, samples, and a detailed API reference.
A list of extensions is provided, but details of their inner workings and usage will be found on their homepages (links provided).
Details on how to use ArcGIS Server and publish spatial data as services is not covered.
While RAMP meets WCAG 2.0 AA compliance, we do not cover the details in meeting those requirements.
Terminology
- AMD
- Asynchronous Module Definition. The API DOJO implements to help achieve a more “object oriented” framework in javascript. Detailed documentation with respect to DOJO’s implementation can be found here
- Anchor Tip
- A map tip that remains open until either manually closed by the user, or another anchor tip is opened. This means you can change the map extent and hover over other features, and the anchor tip will stay active.
- Basemap
- Background imagery on a map that provides context to features. Is non-interactive.
- Bookmark Link
- A URL that will restore some in-session map settings when loaded in a browser, such as where the map was zoomed to, what layers were visible, etc.
- Bounding Box
- A box drawn on the map that indicates the area that a feature set covers.
- Extended Grid
- A grid that has a rich collection of columns. When active, the map is not visible. This provides access to the underlying feature data in a traditional table format, and allows data to be sorted. The extended grid shows the contents of one feature set at a time.
- Highlight
- Causes a feature on the map to stand out from other features and background imagery. Typically accomplished by dulling out non-highlighted imagery.
- Hover Tip
- A map tip that is visible only when the mouse is hovering over a feature.
- RAMP
- Reusable Accessible Mapping Platform. RAMP is a web application that allows for a webmap to be easily created in the WET Template. The site will meet WCAG AA accessibility standards, and will have useful features available for use.
- Static Layer
- A map layer that provides additional context, but is not interactive and is not a basemap. As an example, a static layer with watershed names and boundaries can compliment an active layer showing water monitoring stations.
- Summary Grid
- A grid that has minimal information in it, just enough to identify a point. The summary grid has entries for all features visible, and combines features across different feature sets.
- Topic
- A publication and subscription framework in DOJO. This is used to pass events in the RAMP source.
- WMS
- Web Map Service. An open-source online service that provides mapping information, often in the form of an image of spatial data.
High Level Block Diagram
Popup handling
The utility module PopupManager contains the majority of routines to handle popups. A popup is something that is hidden until the user performs an action, and then the popup appears on the site with the appropriate content.
The core function in PopupManager is registerPopup, which allows the implementor to specify the triggering effects of a popup.
Often we will have popups that will close other popups when they open. Examples of this are the Help panel, the Add Layer panel, and the Bookmark Link panel. This behavior is achieved via topics: a topic is published when a popup is opened. If a listening popup is open, it will close itself. The topics to achieve this end in “_PANEL_CHANGED”
Filtering cycle
In RAMP we do not have any attribute based filtering. Filtering is determined by two factors: the map extent and the visibility of feature layers. A change in either of these two items (user pans/zooms the map, or toggles a layer on or off) will trigger the filtering cycle, which is as follows:
- Retrieve a list of visible layers
- For each visible layer, perform a spatial query on the features using the map extent as the filter criteria. Have the query output objectIds for features that satisfy the filter
- Create a collection of objectId/layerId pairs, and have this be the source for the data grid

Map layer management
The layers exist in the following order on the map
- Basemap Layer
- WMS Layers
- Feature Layers ( includes Static Layers )
- Bounding Box Layers
- Highlighting Layers
- Zoomlight
- Highlight
- Hoverlight
The Feature Layers can be re-ordered via the filter control, but always stay in the same range. WMS Layers can also be re-ordered; however a WMS Layer must always be beneath the Feature Layers (this includes Static Layers and Bounding Boxes). The Basemap is always on the bottom of the layer pile.
The Zoomlight layer will highlight a feature that has been zoomed to from the datagrid. The Hoverlight layer will highlight a feature that the mouse is hovering over. The Highlight layer will highlight a feature that has been clicked on or has it’s details opened.
Datagrid Architecture
The data grid can exist in two different states. This allows the map to be accessible (by providing feature data in a screen readable and keyboard navigateable grid), and also allows a more table-centric view of the data.
The default state is the summary grid. This grid provides basic information about features on the map (name, icon, what layer it belongs to) and provides links to zoom to features and view details about them. This grid works in concert with what is visible on the map; as the user navigates around the map, the grid will stay synchronized with the view.
The alternate state is the extended grid. This grid provides a more traditional multi-column view of the data. When open, the map is no longer visible, and the extent is fixed until the user reverts back to the summary grid. The extended grid shows data from one feature set at a time (this is because different features can have different columns). The active feature can be selected from the dropdown combo box above the grid. It is possible to have the columns in the extended grid be sortable.
- Date modified: